So far, we've been walking through the different algorithms and tools for solving different problems. However, we've never delved into how a data scientist would solve a real-world problem. This next series is going to focus on a real data set from
www.kaggle.com. For those that are unfamiliar with Kaggle, it's a website that hosts data science competitions that allow users from all over the world to use whatever tools and algorithms they would like in order to solve a problem. This data set focuses on credit card fraud. Specifically, the goal is to use a large set of anonymized data to create a fraud detection algorithm. You can find out more about the data set
here.
Some of you may be thinking "I thought this was going to be a real problem, not a fake one!" Turns out, we solved this kaggle problem in almost exactly the same way that we've solved real customers problems at work. The only difference here is that this data has been anonymized in order to protect everyone's privacy.
For this post, let's take a look at the data set.
 |
| Credit Card Fraud Data 1 |
 |
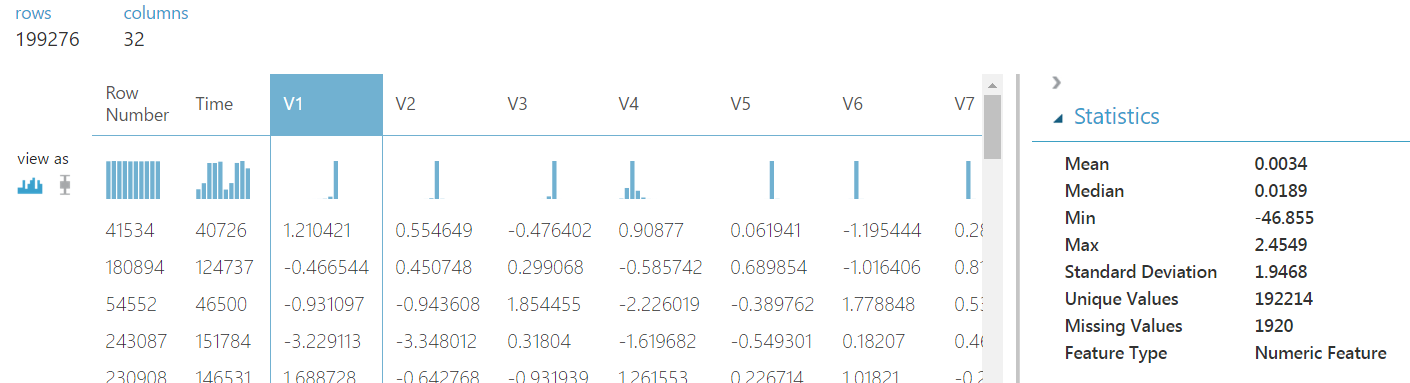
| Credit Card Fraud Data 2 |
We can see that this data set has the following features: "Row Number", "Time", "V1"-"V28", "Amount" and "Class". The "Row Number" feature is simply used as a row identifier and should not be included in any of the models or analysis. The "Time" column represents the number of seconds between the current transaction and the first transaction in the dataset. This information could be very useful because transactions that occur very rapidly or at constant increments could be an indicator of fraud. The "Amount" feature is the value of the transaction. The "Class" feature is our fraud indicator. If a transaction was fraudulent, this feature would have a value of 1.
Finally, let's talk about the "V1"-"V28" columns. These columns represent all of the other data we have about these customers and transactions combined into 28 numeric features. Obviously, there were far more than 28 original feature. However, in order to anonymize the data and reduce the number of features, the creator of the data set used a technique known as
Principal Component Analysis (PCA). This is a well-known mathematical technique for creating a small number of very dense columns using a large number of sparse columns. Fortunately for the creators of this data set, it also has the advantage of anonymizing any data you use it on. While we won't dig into PCA in this post, there is an Azure Machine Learning module called Principal Component Analysis that will perform this technique for you. We may cover this module in a later post. Until then, you can read more about it
here.
 |
| Summarize Data |
Another interesting aspect to note is that this data set contains around 200,000 rows and has a significant number of missing values. This was not a part of the original data set provided by Kaggle. We use this data set as an example for some of our training sessions (training people, not training models). Therefore, we wanted to add some additional speed bumps to the data in order to enhance the value of the training. So, instead of using the single large data sets provided by Kaggle, we provide a training set, which has missing values, and a testing set, which does not. If you would like to use these datasets instead, you can find them
here.
Hopefully we've piqued your interest about Fraud Detection in Azure Machine Learning. Feel free to hop right into the analysis and see what you can do on your own. Maybe you'll create a better model than us! Stay tuned for the next post where we'll be talking about cleaning up this data and preparing it for modelling. Thanks for reading. We hope you found this informative.
Brad Llewellyn
Data Scientist
Valorem
@BreakingBI
www.linkedin.com/in/bradllewellyn
llewellyn.wb@gmail.com


No comments:
Post a Comment